
Skip to content

Glossary ARPU (average revenue per user)

What is ARPU? Average revenue per user, formula and ARPPU

Definition

ARPU (average revenue per user) is the average revenue earned per user over a fixed period: the revenue for the period divided by the number of users in that same period. Each company decides which users count and which revenue goes in. Costs do not appear in the formula, so ARPU measures revenue, not profit.

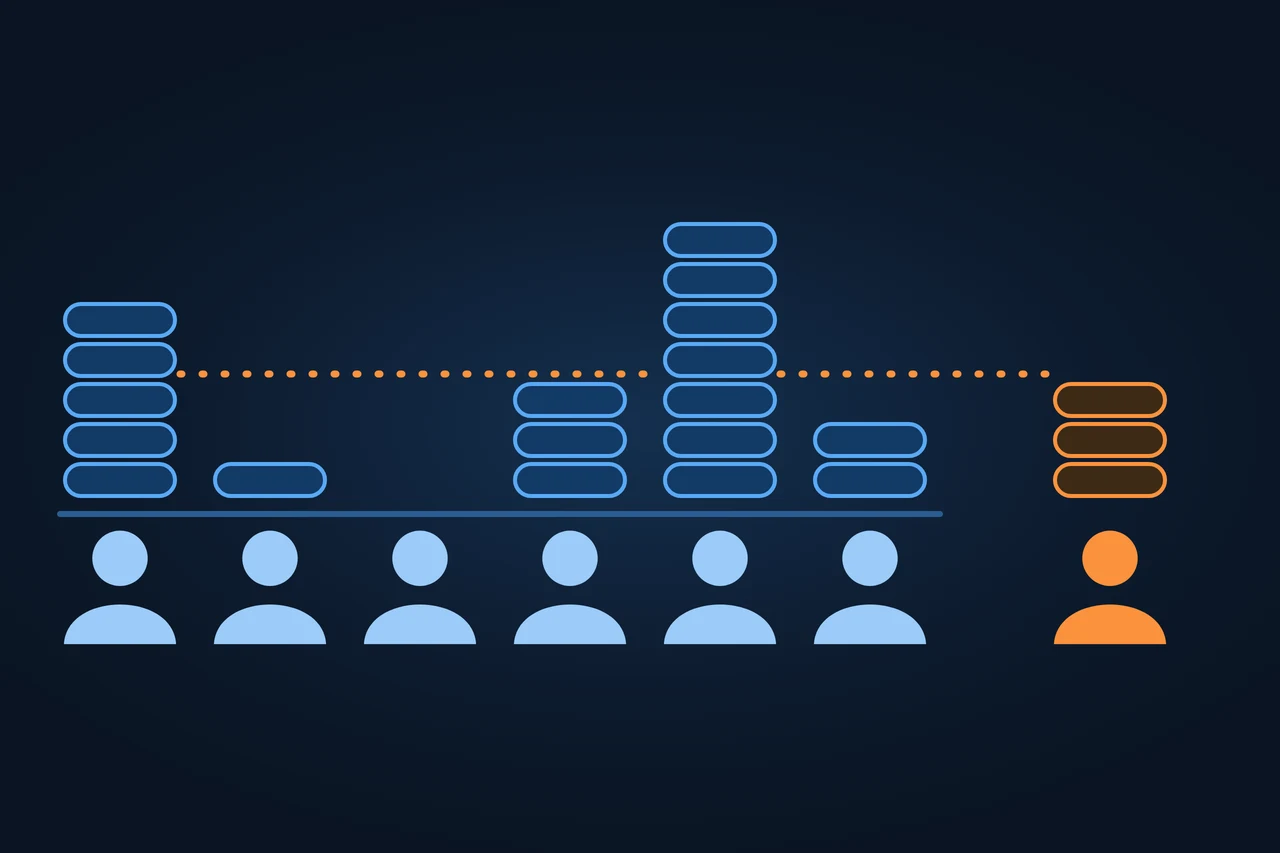
Six people in a row, each below a stack of coins of a different height, one of them with none at all; an orange dotted line marks the average height, passes behind the taller stacks and reaches an orange person on the right with an orange stack of exactly that height, on a dark blue ground.
On this page 11
  1. Origin of the term
  2. How it works
  3. Types and variants
  4. Examples
  5. Advantages and disadvantages
  6. How it differs from related concepts
  7. Criticism and limits
  8. How to apply it, step by step
  9. Best practices
  10. Common mistakes
  11. How this entry was made
In brief

ARPU is the average revenue per user over a period. How to calculate it, which users to count, and how it differs from ARPPU, ARPA, LTV and CAC.

Six people in a row, each below a stack of coins of a different height, one of them with none at all; an orange dotted line marks the average height, passes behind the taller stacks and reaches an orange person on the right with an orange stack of exactly that height, on a dark blue ground.

Origin of the term

The abbreviation stands for “average revenue per user”, and its early use is documented in mobile telephony. The ITU's World Telecommunication Development Report of 1999 calls ARPU “a critical indicator” for mobile operators and notes that it is falling for most of them, partly because of price cuts and partly because newer subscribers tend to spend less than long-standing ones. These sources do not date when the term was coined, or by whom.

Vodafone explains ARPU in its Form 20-F annual report for the financial year ended 31 March 2002 as “average revenue per customer”. It is calculated over twelve months and excludes handset revenues and connection fees. The same report explains why ARPU had fallen: the share of prepaid customers had grown, and according to Vodafone they typically spend less than contract customers.

The Spanish telecoms regulator Comisión del Mercado de las Telecomunicaciones (CMT) defines ARPU in the glossary of its 2009 annual report as the average monthly revenue per customer that an operator earns from electronic communications services. The CNMC speaks in its 2018 and 2020 sector reports of “ingreso medio por línea”, revenue per line. Telefónica Deutschland describes ARPU in the glossary of its 2024 annual report as the average revenue per active user in a given period.

How it works

The basic formula is: ARPU = revenue in the period ÷ users in the period. Three decisions determine the result.

  • Numerator: Facebook counted all sources of revenue in 2017. Vodafone left out handsets and connection fees in 2002. ChartMogul uses only recurring invoice line items for ARPA, not one-off purchases.
  • Denominator: Facebook divided in 2017 by the average of monthly active users at the beginning and end of the quarter, and Meta calculates the same way today, but with people. Snap divides by the daily average of daily active users across the quarter. The regulators count per customer (CMT) or per line (CNMC).
  • Period: Snap and Meta report per quarter, Vodafone calculated over twelve months in 2002, and the CMT per month. Meta's annual figure is the sum of the four quarterly figures.

No binding standard sets the denominator. One convention is the average of the start and end of the period, which Facebook and Meta use. If the user count swings a lot within the period, a daily average like Snap's captures that movement better.

An example with round numbers: an online tool has 900 users at the start of the month and 1,100 at the end, so 1,000 on average. Revenue for the month is €5,000, all from subscriptions. ARPU is €5,000 ÷ 1,000 = €5. If you use the closing count of 1,100 users instead, you get €4.55, and with the opening count of 900 you get €5.56.

Types and variants

The variants differ in the denominator. The table works them out with the example above: of the 1,000 users, 50 pay, and those 50 belong to 25 paying accounts, such as teams. On one day of the month 400 users are active, and revenue that day is €160.

MetricDenominatorCommon inIn the example
ARPUall users in the periodtelecoms, social networks€5,000 ÷ 1,000 = €5
ARPPUpaying users onlyapps, games, freemium€5,000 ÷ 50 = €100
ARPA or ARPCpaying accounts or customersB2B SaaS€5,000 ÷ 25 = €200
ARPDAUusers active on one dayapps, games€160 ÷ 400 = €0.40

Source: definitions from Google Analytics, Unity and Adjust (ARPPU), ChartMogul (ARPA) and Adjust (ARPDAU), accessed on 22.11.2026; the figures are a worked example.

Google Analytics describes ARPPU as total purchase revenue per active user who made a purchase. Unity does not count users who only generate revenue through ads as paying users, and Adjust leaves advertising revenue out. Adjust counts trial users only once they have been charged and warns that with all users in the denominator, the result is ARPU, not ARPPU. When all revenue comes from paying users, ARPU = ARPPU × share of paying users, in the example €100 × 5 % = €5. With advertising revenue on top, ARPU comes out higher than that.

ChartMogul calculates ARPA as MRR divided by the number of paying subscribers and treats ARPA, ARPU and ARPC as the same thing: “Same metric, different names.” Free subscriptions do not count there, while accounts with a failed payment whose subscription is still running do. Adjust calculates ARPDAU as one day's revenue divided by the users active that day, and lets you split it into in-app purchases and advertising.

Examples

Facebook reported ARPU by region in its Form 10-K for 2017. The numerator included all sources of revenue, while the denominator included only users of Facebook and Messenger. According to the report, ARPU in the United States and Canada was more than nine times higher than in Asia-Pacific. The 10-K for 2025 no longer contains ARPU. There Meta reports ARPP (average revenue per person) across the daily active people of all the group's apps, and it updated that definition beginning in the first quarter of 2024.

Snap defines ARPU in its 10-K for 2025 as quarterly revenue divided by average daily active users, and gives an ARPU of $3.62 for the fourth quarter of 2025. Snap justifies the metric by saying it helps the company understand the rate at which it monetizes its daily user base. For this calculation, Snap allocates revenue to the regions where the advertising impressions were delivered.

The CNMC reported the ARPU of mobile operators in its 2018 and 2020 sector reports as revenue per line, sometimes per year and sometimes per month, even within the same report. Two figures can only be compared after checking the definition.

Advantages and disadvantages

ARPU is quick to calculate and needs only two numbers that any billing system provides. With the same definition you can compare months or quarters and see whether a price change or a new plan has moved revenue per user.

The trade-off is that it is an average without costs: it says nothing about margin or cash collected, and between two companies it is only comparable if both set the denominator and the period the same way.

How it differs from related concepts

MRR is the monthly recurring revenue of a subscription business. Divide it by the number of paying accounts and you get ARPA. The other way round, MRR = paying accounts × ARPA, in the example 25 × €200 = €5,000.

Customer lifetime value estimates what a customer brings in over the whole relationship. ARPU is a figure for one period, averaged over all users. ChartMogul puts the difference this way: ARPA tells you what your average subscriber is worth “right now”, while LTV measures the total revenue a customer generates before they churn.

Customer acquisition cost is a cost, and ARPU is revenue. If you set them against each other, the margin has to go in between, otherwise a customer looks more profitable than they are.

Average order value divides revenue by orders, ARPU divides it by users. Someone who orders twice counts twice in average order value and once in ARPU. Revenue per website visitor is not ARPU either, because Snap, Meta and the regulators count registered or active users, customers or lines, not visits.

Criticism and limits

The average hides the distribution. In the example ARPU is €5, but nobody pays €5: 950 users pay nothing and the other 50 pay €100 on average. Putting ARPU next to ARPPU shows how revenue is spread.

ARPU reacts to the mix of users. In 1999 the ITU put the falling ARPU of mobile operators partly down to new subscribers spending less, and in 2002 Vodafone explained its decline with the growing share of prepaid customers. The reverse also holds: ARPU rises when low-revenue users leave, even if no customer pays a cent more.

Changes in how users are counted move the metric. Snap warns in its 10-K for 2025 that adjustments to how daily active users are measured also affect ARPU, and that the figures may then not be directly comparable with earlier periods.

One revenue figure, divided by every user, by payers or by accounts

How to apply it, step by step

  • Set the period, month or quarter, and stick to it.
  • Set the denominator: all users, active users, paying users or accounts, plus the method, such as the average of the start and end of the period.
  • Decide which revenue counts: subscriptions, one-off purchases, advertising.
  • Calculate ARPU and ARPPU side by side.
  • Break the figures down by segment or plan.
  • Split every change into a price effect (the same users pay more) and a mix effect (the user base has a different composition).

Best practices

  • Put the definition next to every ARPU figure in a report.
  • Compare ARPU figures only when the denominator and period are the same.
  • Always show the user count that an ARPU figure comes from.
  • Read ARPU together with churn and acquisition cost.

Common mistakes

  • Reading ARPU as a measure of profitability.
  • Using the closing count instead of the average without saying so.
  • Mixing up ARPU and ARPPU.
  • Comparing monthly, quarterly and annual figures with each other.
  • Comparing the ARPU of two companies that count differently.

How this entry was made

This entry was written in November 2026 with the help of AI. The information comes from reports by the ITU, the CMT and the CNMC, from the annual reports of Vodafone, Facebook, Meta, Snap and Telefónica Deutschland, and from the documentation of Google Analytics, Unity, Adjust and ChartMogul, all accessed on 22.11.2026. The worked example uses round figures. It was reviewed before publication and contains no client data.

Manuel Riveiro Rodriguez CEO & Digital Strategist

A technical audit covers this and everything else in one pass.

Request an audit

Frequently asked

How is ARPU calculated?

Revenue in the period divided by the users in the period. One convention for the denominator is the average of the start and end of the period: with 900 users at the start of the month, 1,100 at the end and €5,000 in revenue, that gives €5,000 ÷ 1,000 = €5.

Is ARPU monthly or annual?

Both occur, and there is no fixed rule. Snap and Meta report per quarter, Vodafone calculated over twelve months in 2002, and the Spanish regulator CMT defined it per month. Always state the period alongside the figure.

What is the difference between ARPU and ARPPU?

ARPU divides revenue by all users, ARPPU only by paying users. If 50 of 1,000 users pay, ARPPU is twenty times ARPU for the same revenue.

What is the difference between ARPU and LTV?

ARPU is revenue per user for one period. LTV, or customer lifetime value, estimates what a customer brings in over the whole relationship, until they cancel.

What is ARPU in telecom?

The average revenue an operator earns per customer or per line. Vodafone defined it in 2002 as average revenue per customer over twelve months, excluding handsets and connection fees, and Spain's CNMC reports it as revenue per line.

Sources

  1. ITU, “World Telecommunication Development Report 1999: Mobile Cellular - Summary - Page 19”.
  2. Vodafone Group Plc, Form 20-F for the financial year ended 31 March 2002, filed with the SEC on 19.06.2002.
  3. Comisión del Mercado de las Telecomunicaciones, “Informe Anual 2009”, Glosario (in Spanish).
  4. CNMC, “Informe Económico Sectorial de las Telecomunicaciones y el Audiovisual 2018” (in Spanish).
  5. CNMC, “Informe Económico Sectorial de las Telecomunicaciones y el Audiovisual 2020” (in Spanish).
  6. Telefónica Deutschland Holding AG, “Geschäftsbericht 2024”, glossary, copy in the German Bundestag's lobby register (in German).
  7. Facebook, Inc., Form 10-K for fiscal year 2017, filed on 01.02.2018.
  8. Meta Platforms, Inc., Form 10-K for fiscal year 2025, filed on 29.01.2026.
  9. Snap Inc., Form 10-K for fiscal year 2025, filed on 05.02.2026.
  10. ChartMogul Help Center, “Report: Average Revenue Per Account”.
  11. ChartMogul, “Average Revenue Per Account (ARPA)”.
  12. Google Analytics Help, “ARPPU”.
  13. Unity, “What is ARPPU: ARPPU Definition”.
  14. Adjust, “What is average revenue per paying user (ARPPU)?”.
  15. Adjust, “What is average revenue per daily active user (ARPDAU)?”.